PowerSearchingWithGoogle.com
Lesson 5.2: Variant data
Contents:
This is lesson 5.2. This entire class 5 is all about credibility and in this particular lesson I want to talk to you about how data varies depending on the questions you ask, how you ask those questions and even when you ask those questions. So let's talk about some things that seem very straightforward, things that should have very simple, very straightforward, say even quantitative answers. A number for example, [what's the longest river] that should be easy to determine. But, one of the big lessons of this entire class is it depends and it depends on a lot of things. So let's think about something simple like what's the circumference of our planet, how big is the earth?
You could go to Google and type in the [circumference of the earth] but I want you to think carefully about what that means.
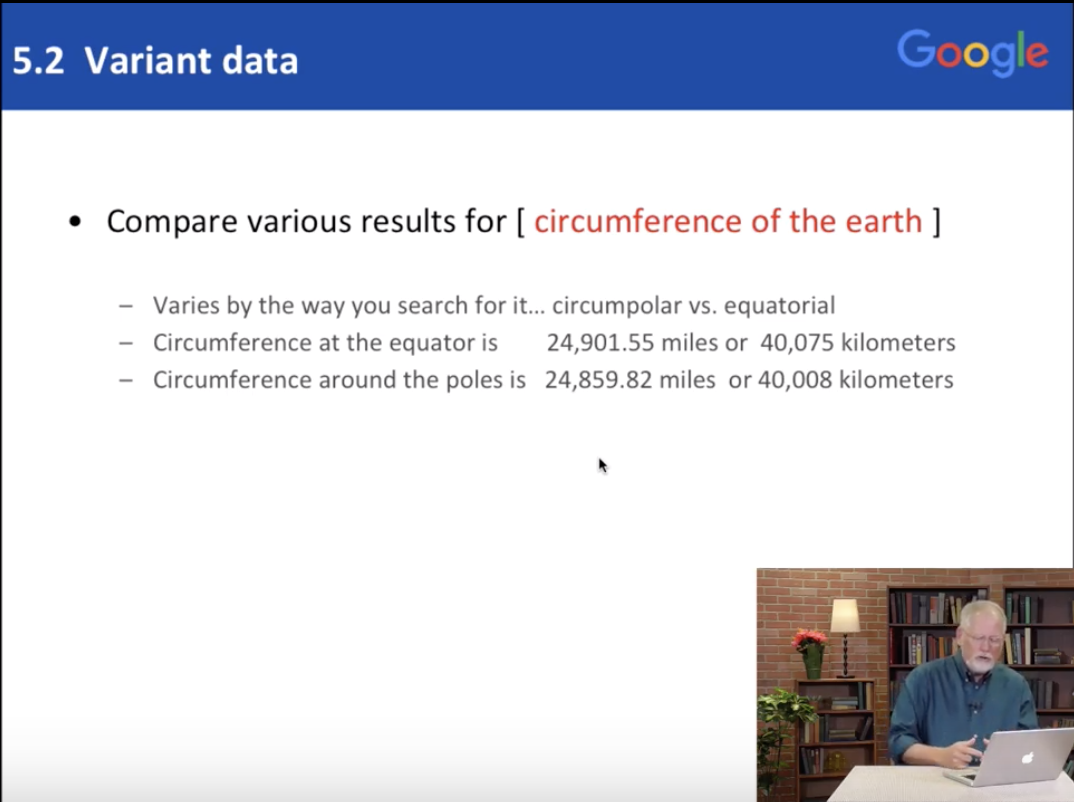
The answer differs depending on how you ask the question and that is determined by how you measure. If you have a planet and you go around the equator that's one distance, if you go circumpolar, that is from pole to pole, that's a different distance. Turns out the earth is not exactly a sphere, it’s slightly flattened. If you measure one direction versus the other, the answer varies. Think about this as a general principle, lots of answers to even simple questions vary depending on the circumstances of the thing you're measuring and how you measure it. As you can see here circumference of the Equator is twenty four thousand nine hundred miles or forty thousand kilometers. If you measure around the poles it's a little different, it's a hundred and some odd miles different, so you can see the difference.
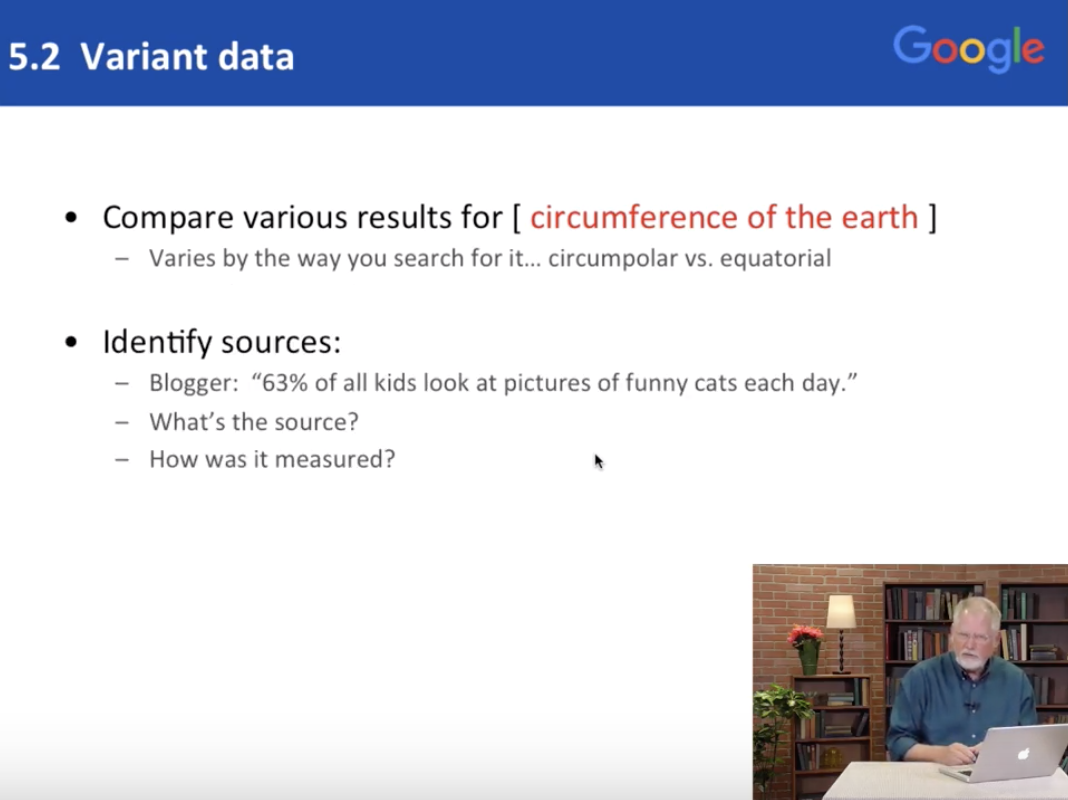
That's an interesting interesting piece of data. When you're asking questions like [how many kids look at funny pictures of cats] you might find a blogger source that says that was 63%.
You, as the discerning researcher, you as a great person who knows how to use online resources might think: What was that source? Who is that blogger? How do they measure that? Is it accurate or were they just sticking a finger up in the wind and saying I think it's 63%. When you read information like this think to yourself: How can I verify this? Well, how did they verify that? And are they measuring what we think we're measuring? So 63% of all kids look at funny pictures of cats each day. What's a kid? What's a funny cat? How do they measure that? See what I mean?
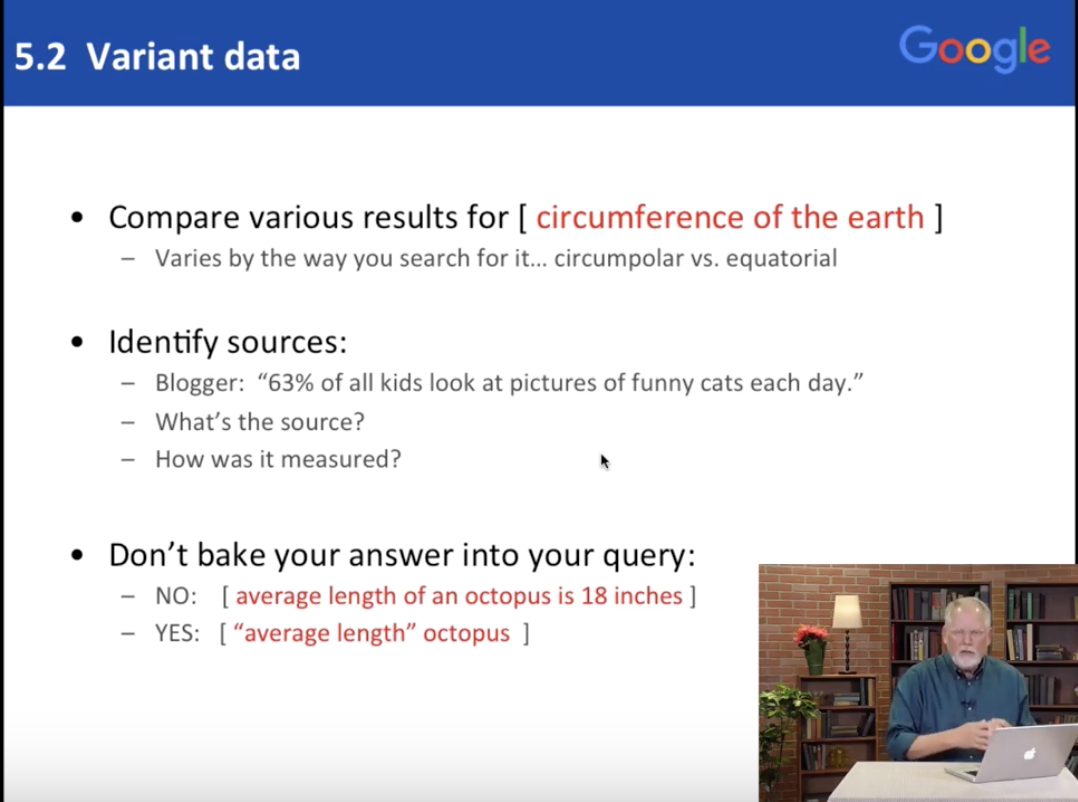
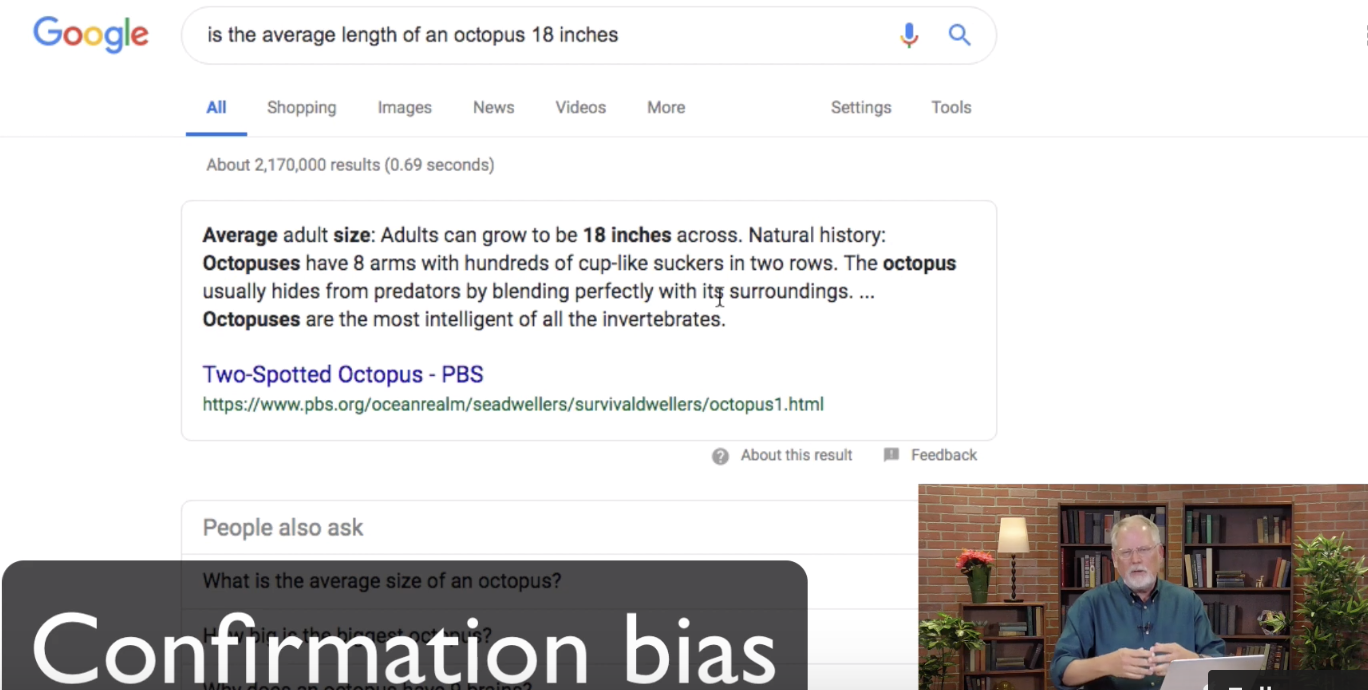
A lot of what we're looking for is information that's on the web, but your question may presuppose the answer. That is, you might bake in, you might lead the witness towards a particular kind of answer. You might ask Google a question like the [average length of an octopus is 18 inches.] You might be looking for confirmation and that's one way to get it, because trust me somewhere on the web somebody has written the average length of an octopus is 18 inches. What you don't want to do is to bake the answer into your query, that is doing a query like this [average length of octopus] is a much better query, let me show you this live.
Let's do a simple question like [is the average length of an octopus 18 inches]. So that's a reasonable query and look at this we have a nice web answer that says adults can grow to be 18 inches across and you might think you've found the answer, no. What you've done is confirm what you asked, be aware that we all live in a world where we try to confirm what we believe.
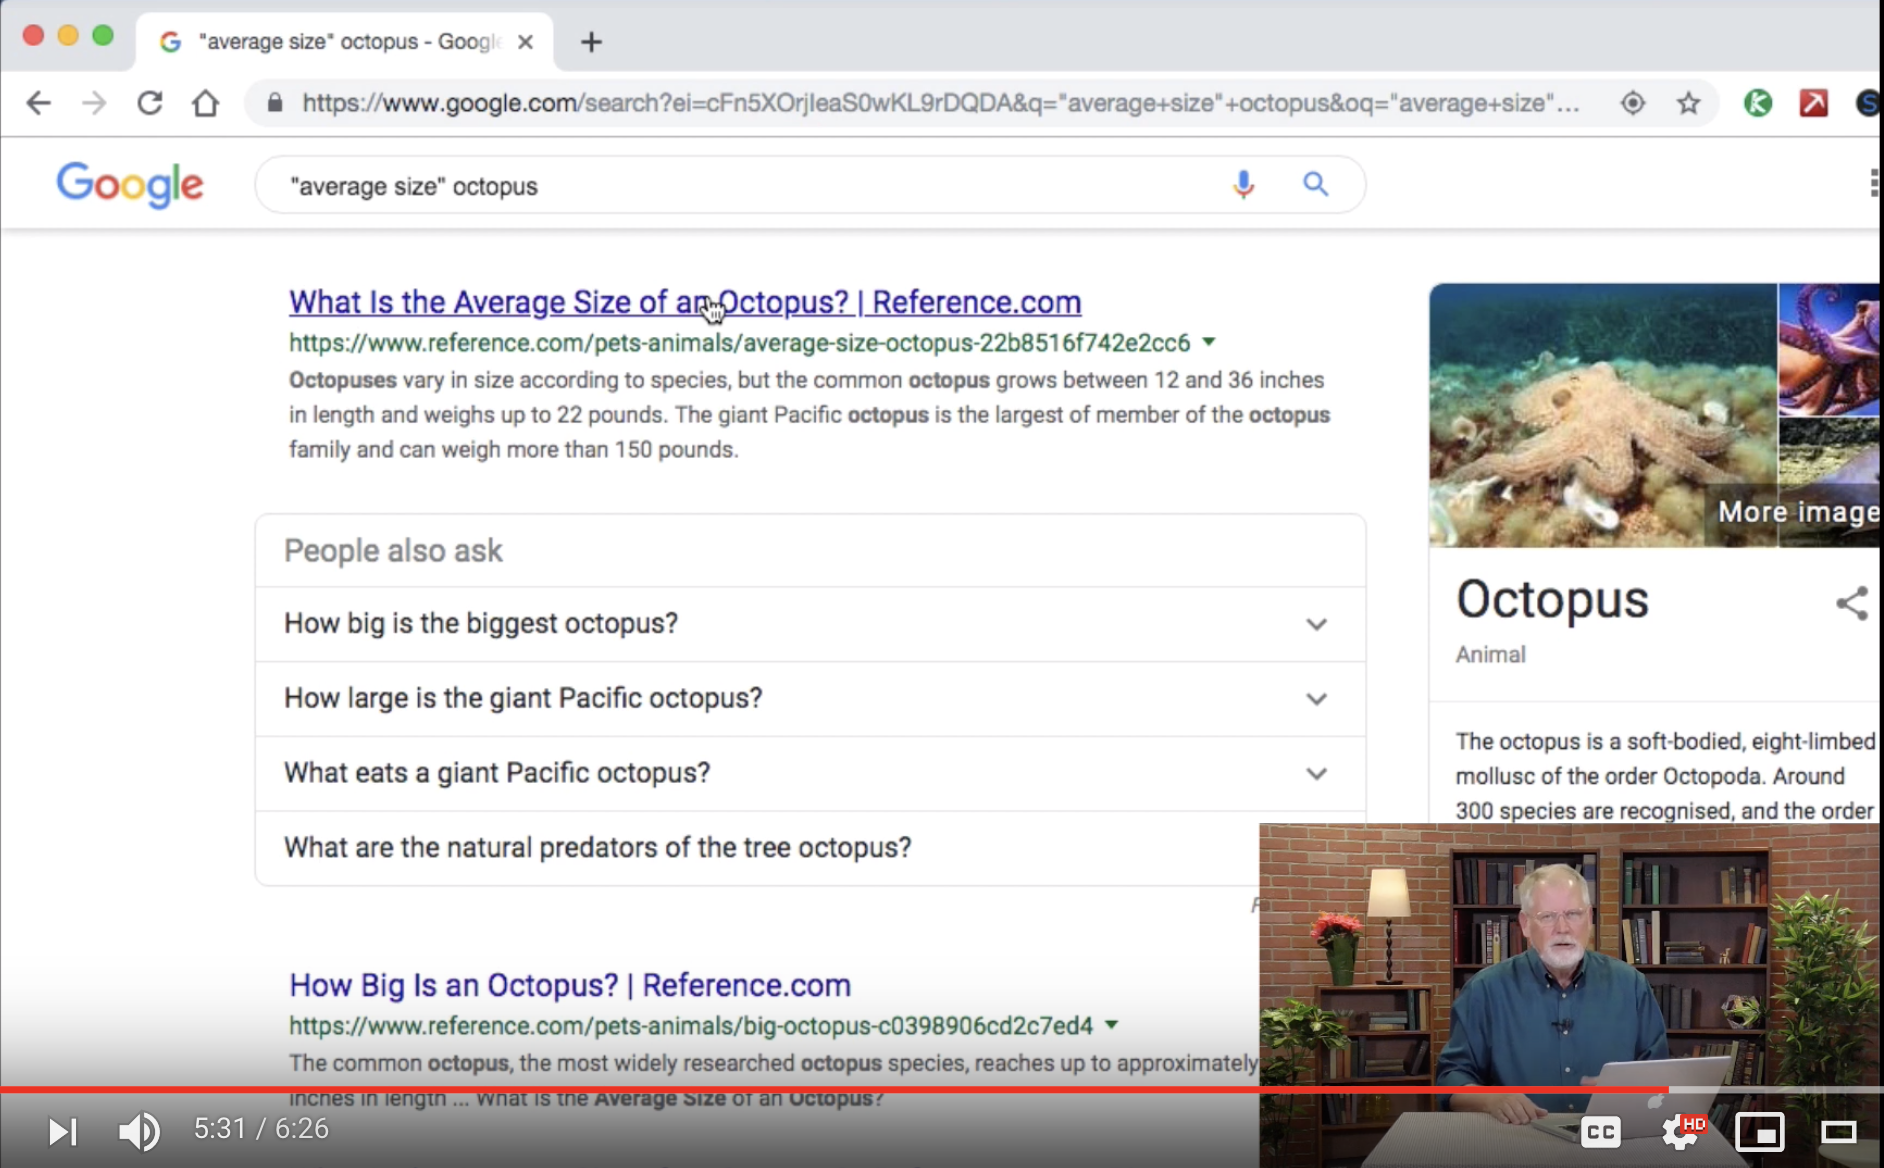
This is called confirmation bias, confirmation bias says that we humans love to look for answers that confirm what we already believe. If you see this you are confirming what your query is all about. So, let's see here you can see and yeah there's lots of stuff including things like 18 feet long and so on. So, the point is, don't just accept this page of results as the authoritative answer let's redo our query to [average-size octopus]. Now this it points out an interesting question here, what's the average length of an octopus, is it from the tippy top of the head to the bottom of the longest tentacle or is it from tentacle to tentacle going across like that? Octopi as you know can be very squishy and they can be very flat and long or they can compose themselves into a relatively small space so this query [average sized octopus] gets at that difference.
So, look at this, we've got a bunch of information of octopus that's great, we can see here the average size of an octopus answered by a credible source here gives you a space of possibility, so if you go and open this resource you'll see that an octopus can vary from very small to very large and average is a little bit funny concept here. Yes, you can compute an average of any data set like this but they vary so much that you have to wonder what does average mean, what is the average size of such a big data distribution?
So, in this lesson I tried to give you a sense that you might want to look a little more deeply into where your data is coming from, how your question, your query, might be biasing or affecting the results because think about this when you do a query you're searching over the entire Internet, you're looking over incredibly huge variety of content so do not ask confirmations, that is don't bake your answer into the query itself. Ask it in a more open-ended way that allows you to look at different resources, different types of data and allows you to then evaluate it for credibility. Go ahead and explore the questions you see in the activity.
Power Searching with Google © 2019 Google, Inc. CC-BY-SA
(Updated 7/2019 A. Awakuni Fernald)